What Is RMM? The Complete Guide to Remote Monitoring and Management
If you manage IT infrastructure for clients or for an internal team, you have either already adopted an RMM platform or you are evaluating one. Remote Monitoring and Management software is the operational backbone of managed service providers and internal IT departments alike. It is also one of the most misunderstood categories in the IT tooling space — partly because every vendor defines it differently, and partly because the category has evolved significantly in the last five years.
This guide covers what RMM software actually does, how it works at a technical level, who uses it and why, and what separates a modern RMM platform from the legacy tools that still dominate market share. If you are evaluating RMM tools for the first time, switching from an existing platform, or just trying to understand the landscape, this is the reference.
What RMM Software Actually Does
At its core, RMM software does two things: it monitors endpoints remotely, and it lets you manage those endpoints without physically touching them. “Endpoints” means workstations, laptops, servers, network devices, mobile devices — anything with an IP address that someone needs to keep running.
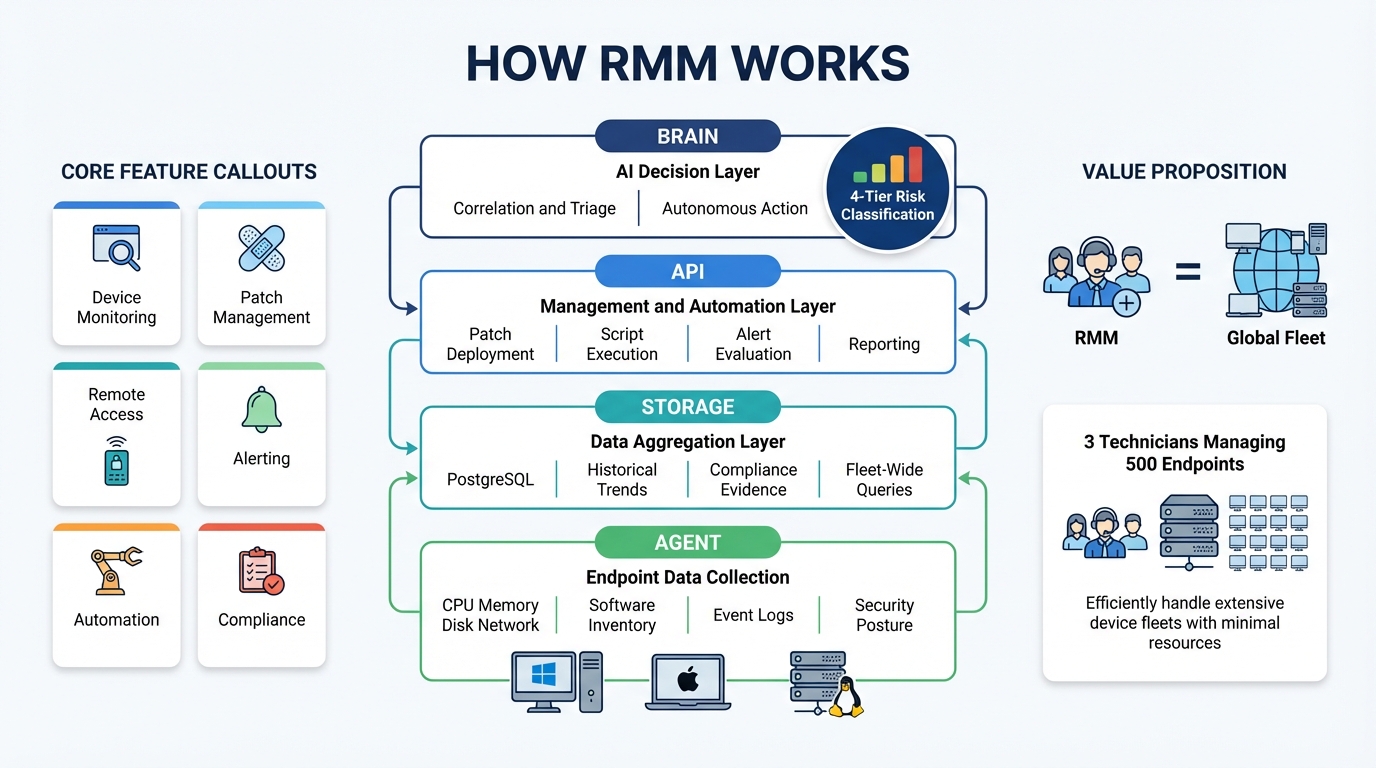
The monitoring side collects data continuously. CPU utilization, memory consumption, disk health, network throughput, installed software, security posture, event logs, running processes, service states. This data gets aggregated, stored, and compared against thresholds you define. When something crosses a threshold — a disk fills past 90%, a critical service stops, a patch fails to install — the platform generates an alert.
The management side lets you act on what the monitoring reveals. Deploy a patch. Restart a service. Run a script. Push a configuration change. Transfer a file. Connect to a remote desktop session. These actions happen over encrypted connections without requiring VPN access to the client’s network, without the end user knowing you are there (in most cases), and without driving to the site.
That is the surface-level description. The real value proposition is deeper: RMM lets a small team manage a large fleet of devices at a cost structure that would be impossible with manual, on-site IT support. An MSP with three technicians can manage 500 endpoints because the platform handles the data collection, alerting, and routine actions that would otherwise consume those technicians’ entire day.
Who Uses RMM — and Why
Two primary audiences use RMM software.
Managed Service Providers (MSPs) are IT companies that manage technology infrastructure for other businesses on a subscription basis. The MSP model only works if the cost of delivering service is lower than the recurring revenue from clients. RMM is what makes that math possible. Without it, an MSP would need technicians on-site at every client location, which destroys the margin that makes the business viable.
MSPs typically manage multiple clients, each with their own networks, security requirements, compliance obligations, and user populations. The RMM platform needs to support multi-tenancy — clean separation between clients so that a technician working on Client A’s devices cannot accidentally affect Client B’s environment. This sounds obvious, but the implementation details matter. Poorly implemented multi-tenancy creates compliance risk and operational errors.
Internal IT teams at mid-size and large organizations use RMM for the same operational reasons, minus the multi-tenant requirement. A company with 300 employees across four offices needs the same visibility into device health, the same ability to push patches remotely, the same alerting when something breaks. The alternative is walking between desks or relying on users to report problems — neither of which scales.
A growing third audience is IT consultants and small IT shops that manage a handful of clients without the full MSP infrastructure. They need the same capabilities but cannot justify the cost or complexity of enterprise-grade platforms. This is the segment that has been most underserved by the market, and it is the segment where pricing and feature bundling decisions matter the most.
Core Features of an RMM Platform
Every RMM platform covers the same core feature areas, though the depth and quality of implementation vary dramatically.
Device Monitoring and Inventory
The foundation. The platform needs to know what devices exist, what hardware they have, what software is installed, what their current status is, and how they are trending over time. This is not a point-in-time snapshot — it is continuous data collection that builds a historical record. You should be able to answer questions like “when did this device start showing high memory usage?” and “which devices have an outdated version of this application?” without running a manual scan.
Breeze implements this through structured data collection at the agent level, stored in PostgreSQL with proper indexing and retention policies. The result is a queryable inventory that both human technicians and AI agents can work against — not a dashboard you stare at, but a data layer you build on. See how this works in practice at /features/device-management.
Patch Management
Patching is the single most impactful thing an IT team does for security. Most breaches exploit known vulnerabilities with available patches. The challenge is not knowing that patches exist — it is deploying them across hundreds of devices with different configurations, testing requirements, and maintenance windows, without breaking production workloads.
A good patch management system handles discovery (what patches are available), approval workflows (which patches are authorized for deployment), scheduling (when patches deploy), deployment (actually installing them), verification (confirming they installed correctly), and rollback (undoing patches that cause problems). Many RMM platforms handle the first three and leave the rest as manual processes.
Breeze treats patching as a lifecycle, not a one-off task. Approval workflows, deployment scheduling, verification, and rollback are built into the same pipeline. Details at /features/patch-management.
Remote Access
The ability to connect to a device and control it as if you were sitting in front of it. This is the feature that eliminates truck rolls — instead of driving to a client site to troubleshoot a problem, you connect remotely, diagnose, fix, and disconnect.
Remote access implementations vary. Some RMM platforms include their own remote desktop solution. Others integrate with third-party tools like ConnectWise ScreenConnect or Splashtop. The built-in solutions are usually “good enough” — functional but not feature-rich. The integrations add cost and complexity.
The important technical details are latency (how responsive the remote session feels), security (how the connection is authenticated and encrypted), unattended access (whether you can connect when no one is at the device), and multi-monitor support. Breeze includes remote access natively — no add-on required. See /features/remote-access.
Alerting and Notifications
Monitoring data is only useful if it surfaces problems before users call to report them. Alert systems compare incoming telemetry against defined thresholds and generate notifications when conditions are met. Simple implementations fire an alert when a single metric crosses a single threshold. Better implementations support compound conditions (“CPU above 90% AND memory above 85% for more than 10 minutes”), suppression rules (do not alert during maintenance windows), and escalation paths (alert the on-call tech first, then the team lead if unacknowledged after 15 minutes).
The common failure mode is alert fatigue. A poorly tuned alert system generates so many notifications that technicians ignore all of them, which means the critical alerts get lost in the noise. The platform needs to make it easy to tune thresholds, suppress known-good conditions, and escalate intelligently. Breeze’s approach to this is policy-driven — you define alert configurations once and they inherit through the organizational hierarchy.
Automation
The gap between “monitoring detected a problem” and “a technician fixed the problem” is where most RMM inefficiency lives. Automation closes that gap for predictable, repeatable issues. Disk full? Run a cleanup script automatically. Service stopped? Restart it. Patch failed? Retry with a different configuration.
Automation in RMM ranges from simple “if-then” rules to full workflow orchestration with branching logic, approval gates, and conditional execution. The more sophisticated the automation engine, the more of the routine workload it absorbs, freeing technicians for problems that actually require human judgment.
Breeze implements automation as policy-driven workflows — event-driven, scheduled, webhook-triggered, and manual — through a configuration system that scales across the fleet. Details at /features/automation.
Scripting
The ability to write and deploy custom scripts to managed devices. PowerShell on Windows, Bash on Linux and macOS. This is the escape hatch that lets you do anything the platform does not have a built-in feature for. Good scripting implementations include a script library (reusable scripts shared across the team), variable injection (pass device-specific values into scripts at runtime), output capture (see what the script returned), and scheduling (run scripts on a recurring basis).
Reporting
Clients and management want proof that their IT investment is working. Reports translate the raw monitoring data into documents that non-technical stakeholders can understand: uptime percentages, patch compliance rates, security posture scores, ticket resolution times. The reporting feature is often an afterthought in RMM platforms, which means MSPs end up exporting data to Excel and building reports manually. That is a significant time sink. Breeze includes reporting and analytics natively — see /features/reports-analytics.
How RMM Works: Agent-Based Architecture
Nearly every RMM platform uses an agent-based architecture. A lightweight software agent is installed on each managed device. That agent handles data collection and command execution on the endpoint, communicating back to a central server (either cloud-hosted or self-hosted) over encrypted channels.
The agent typically runs as a system service with elevated privileges. It needs those privileges to collect hardware data, install patches, manage services, and execute scripts. The agent communicates with the server on a defined interval — usually every 1 to 5 minutes for status updates, with real-time channels for alerts and commands.
The central server aggregates data from all agents, runs alert evaluation logic, serves the web-based management console, exposes the API, and dispatches commands back to agents. In a cloud-hosted deployment, the vendor operates the server infrastructure. In a self-hosted deployment, you run it on your own hardware or cloud instances.
Breeze’s agent is written in Go and runs on Windows, macOS, and Linux. It collects structured data — hardware metrics, software inventory, SMART drive health, boot performance, security posture, event logs — and ships it to the API layer. The agent is a data collector and command executor. It has no opinions about what the data means. That interpretation happens at the API and AI layers above it.
The alternative to agent-based monitoring is agentless monitoring, which typically uses protocols like WMI, SSH, or SNMP to query devices remotely. Agentless approaches avoid the need to install software on every endpoint but sacrifice depth of data collection, real-time responsiveness, and the ability to execute management actions. Most serious RMM platforms use agents for managed devices and agentless protocols for network infrastructure (switches, routers, firewalls, printers).
How to Evaluate RMM Tools
If you are comparing RMM platforms, these are the criteria that actually matter. Marketing pages will not tell you most of this — you need a trial or a demo with technical depth.
Pricing model. Per-device pricing is the industry standard, and it is the model that hurts small MSPs the most. Every new endpoint you onboard increases your cost, which means your margins shrink as you grow unless you raise prices proportionally. Look for platforms that charge per technician or offer flat-rate pricing. Breeze charges zero per-device fees — every endpoint is included.
Feature bundling. Many RMM vendors sell a “base” platform and charge separately for remote access, patch management, antivirus integration, backup monitoring, and reporting. These add-ons compound quickly. A platform that looks affordable at the base price can cost 2-3x more once you add the features you actually need. Look for platforms where the full feature set is included.
Multi-tenancy. If you are an MSP, the platform needs clean client separation with granular permissions. Can you give a client read-only access to their own dashboard? Can you scope a junior technician to specific clients? Can you apply different policies to different clients without manual configuration per device?
API coverage. If the platform does not have a comprehensive API, you will hit a wall when you try to integrate it with your PSA, your billing system, or any automation you build. Ask specifically: can every action the UI performs also be performed via API? If the answer is no, the API is a second-class citizen and you will be limited.
Self-hosted option. Cloud-hosted is fine for most use cases, but some clients — government, healthcare, finance — require data sovereignty. If you cannot self-host the platform, you cannot serve those clients. Breeze supports both cloud-hosted and self-hosted deployments.
Compliance support. If your clients need to demonstrate compliance with frameworks like CIS Controls, NIST, HIPAA, or SOC 2, the RMM platform is where most of the evidence comes from. Does the platform collect the right data, retain it for the right duration, and produce reports in a format assessors will accept?
The Future of RMM: AI-Native Approaches
The RMM industry is at an inflection point. For twenty years, the architecture has been the same: agents collect data, servers aggregate it, dashboards display it, humans interpret it and take action. AI changes that loop fundamentally.
The first wave of “AI in RMM” was cosmetic — chatbots on dashboards, natural language search over documentation, predictive analytics that amounted to trend lines with confidence intervals. Useful at the margins, but not transformative.
The second wave, which is happening now, is structural. AI agents that can reason over device data, correlate signals across the fleet, propose actions with stated rationale, and execute approved actions through the same API that human technicians use. This is not a chatbot. It is a decision layer that sits between the data and the human, absorbing the interpretation and triage work that consumes most of a technician’s day.
Breeze was designed for this from the start. The four-layer architecture — agent, storage, API, brain — treats the AI as a first-class consumer of the RMM data layer. The API is structured for agent reasoning, not just human dashboard consumption. Every action has a risk classification that determines whether the AI can execute it autonomously, needs to notify a human, or requires explicit approval. This is not AI bolted onto an existing RMM. It is an RMM built for AI consumption from the foundation up.
The practical impact for MSPs and IT teams is significant. An AI-native RMM does not just show you that twelve devices are alerting — it tells you that all twelve are at the same site, the alerts correlate with a network outage that started at 1:47 AM, and the recommended action is to check the switch at that location rather than troubleshooting each device individually. That correlation, which takes a human technician five to ten minutes of clicking through dashboards, takes the AI two seconds.
The platforms that will lead the next decade of RMM are the ones being built for this architecture today. The platforms that are retrofitting AI onto twenty-year-old codebases will deliver incremental improvements. The gap between those two approaches will widen as the AI capabilities improve — and they are improving fast.
Getting Started
If you are evaluating RMM platforms, the best advice is concrete: install the agent on ten devices, use it for a week, and see if the data collection, alerting, and management workflows match how your team actually works. Marketing pages and feature checklists do not tell you whether the platform feels right in daily operation. A trial does.
Breeze is open source. You can self-host it today, install the agent, and evaluate the full platform — all 44 modules, no feature gates, no per-device fees — without talking to a sales team. The code is at github.com/breezermm/breeze. If you want the AI brain layer on top, that is LanternOps, the commercial intelligence layer built on Breeze.
Start with the features overview to see what is included, or jump directly to the areas that matter most for your evaluation: device management, patch management, remote access, or automation.
Related